
fNIRS Tools
Basic preparation for using NFRI_functions
NFRI_functions are set of MATLAB functions to perform probabilistic registrations according to our paper by Singh AK, Okamoto M et al. Neuroimage 27, 842-851 (2005). Please start by downloading the zip file and ReadMe file indicated below.
Please unzip the zip file, “20121120_nfri_functions.zip”, and save the unzipped folder “nfri_functions” to any directory. AVOID USING DIRECTORY NAME with MULTI-BITE CHARACTERS in the path to the folder so that Matlab can well find the appropriate folder.
You need Matlab to run the tools. Version 7.1 or later would work fine. Run Matlab, and go to the nfri_functions directory or set a path to the directory. Then, you are ready for enjoying the tools.
For downloading zipped functions, please click here.
ReadMe file is also available here.
Individual spatial analysis with “nfri_mni_estimation”
This function probabilistically registers individual subject’s NIRS probe positions obtained in a real-world coordinates to the MNI space. Instead of using subject’s own MRI dataset, which is not obtained in a typical NIRS measurement, the function pick up brains in the reference database, and “probabilistically” registers the subject’s NIRS probe onto the MNI-152 compatible canonical brain that is optimized for NIRS analysis. For each NIRS probe position, a set of MNI coordinates (x, y, z) with an error estimate (standard deviation) will be calculated.
Further information is available in “ReadMe091114.doc” file indicated above.
Group spatial analysis with“MultiSubject4_0”
This tool sums up the results of individual analyses to yield group analysis data. This is just a beta version, so stored in an independent directory. But it works fine.
Further information is available in “ReadMe091114.doc” file indicated above.
Anatomical labeling with “anatomlabel_final”
This function reads a list of MNI coordinate values and estimates anatomical labeling using several anatomical labels available for academic use. Please be reminded that we just assemble them for easier access and you have to respect the original developers. So, cite the original articles when you use them. Appropriate citations are as follows:
AAL(automatic anatomical labeling): Tzourio-Mazoyer, N., Landeau, B., Papathanassiou, D., Crivello, F., Etard, O., Delcroix, N., Mazoyer, B., Joliot, M., 2002. Automated anatomical labeling of activations in SPM using a macroscopic anatomical parcellation of the MNI MRI single-subject brain. NeuroImage 15 (1), 273– 289.
Brodmann area (Chris rorden’ MRIcro): Rorden, C., Brett, M., 2000. Stereotaxic display of brain lesions. Behav. Neurol. 12, 191– 200.
LPBA40: Shattuck DW, Mirza M, Adisetiyo V, Hojatkashani C, Salamon G, Narr KL, Poldrack RA, Bilder RM, Toga AW. Construction of a 3D probabilistic atlas of human cortical structures. Neuroimage 2007; 39: 1064-1080.
Brodmann area (Talairach daemon): Lancaster JL, Woldorff MG, Parsons LM, Liotti M, Freitas CS, Rainey L, Kochunov PV, Nickerson D, Mikiten SA, Fox PT. Automated Talairach atlas labels for functional brain mapping. Human Brain Mapping 2000; 10: 120-131.
Further information is available in “ReadMe091114.doc” file indicated above.
Plotting functional data onto MNI space with “nfri_mni_plot” and “nfri_mni_plot_imp”
The function nfri_mni_plot is a handy plotter that primarily exhibits cortical activation data onto the MNI-compatible canonical brain. Activation data can be any values such as t-value, F-value, regression coefficient, mean amplitude and so on. They are expressed according to a color scale. The size of plotted channel or probe positions can also be varied. Missing data are exhibited in gray. Out-of-range data can also be expressed wither in black and white.
The function nfri_mni_plot_imp is a slightly modified version of nfri_mni_plot, generating impressionistic drawing of data. The edge of a sphere is blended with background color to yield impressionism-painting-like outlook. It works best with uniform size spheres to be drawn, and usually serves for final data preparation for a conference presentation or journal article. The usage is totally the same as nfri_mni_plot. However, nfri_mni_plot is much faster, especially for a large number of channels.
Further information is available in “ReadMe091114.doc” file indicated above.
Tools for realizing spatial registration on POTATo (Platform for Optical Topography Analysis Tools)
This is a tentative release of the POTATo tools. More precise and user-friendly instruction will appear later.
Click here for download.
MNI coordinates and Macro-anatomical labels for 10/20, 10/10 and 10/5 positions
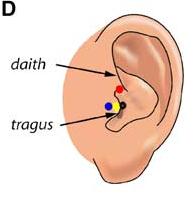
Here are lists of MNI coordinates and macroanatomical labels for 10/20, 10/10 and 10/5 positions. Please read the reference by Jurcack, Tsuzuki and Dan, NeuroImage (2007) for detailed information. You first need to choose either of the following pre-auricular points to define particular 10/20-based systems that you would like to adopt. Please check out the following figure.
Download the excel files as listed below for your reference.
1) Anterior root of the center of the peak region of tragus (=UI-10/5), Blue
2) Dent between upper edge of tragus and daith; Red
3) External ear canal; Black
More from this site
 Dan’s presentation for Frontiers’ Webinar PDF file for Dan’s presentation is available here.
For […]
Dan’s presentation for Frontiers’ Webinar PDF file for Dan’s presentation is available here.
For […]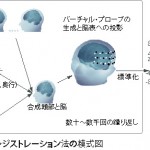 バーチャルレジストレーション バーチャル(仮想)レジストレーションとは?
バーチャル・レジストレーション法は、MRIも3Dデジタイザーも用いずに標準脳座標系へのレジス […]
バーチャルレジストレーション バーチャル(仮想)レジストレーションとは?
バーチャル・レジストレーション法は、MRIも3Dデジタイザーも用いずに標準脳座標系へのレジス […]- Neuroergonomics 2018 Neuroergonomics 2018の Plenary […]
2013/06/01